Using tags in Azure is a great way to logically organise resources by categories. Combining tags with the Power BI Microsoft Azure Consumption Insights connector should offer a powerful way to analyse and gain insights into your Azure expenditure.

Unfortunately, the connector imports the tags as a single field containing the tagging JSON, which makes it difficult to work with the tags in a meaningful way. For example, if you have tags called System, Geography and Environment it would be great to be able to work with these in Power BI as an individual fields. Fortunately, this is possible, but not with Power BI in the browser.
Download Power BI Desktop and get data from the Microsoft Azure Consumption Insights (Beta).

Enter your EA enrollment number, which you can get from https://ea.azure.com/ . You’ll also need an API access key, which is available from https://ea.azure.com/ under reports -> download usage -> API access key.
Select UsageDetails, then right-click and select edit.

If you’ve only recently added tags order the data by date descending. This is because the Power BI editor loads 1000 rows initially and if you’ve only recently started using tags they’ll only be listed against recent records.
Find the Tags column, right-click choose Transform, followed by JSON.

Power BI will now parse the JSON and enable you to split out each tag into a separate column. Click on the arrows and the tag fields will be loaded.

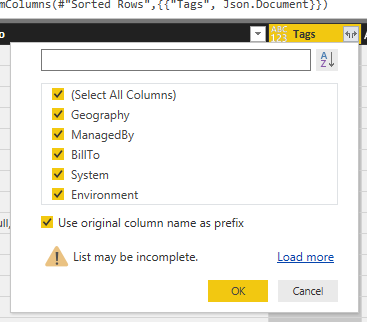
Click ok to add the new tag fields to the data set, followed by close & apply.

You can now work with each tag individually.


Pingback: Azure IaaS Cost Optimisation | Richard Skinner